
Objectively evaluating trading signal performance is crucial for any trader aiming for consistent profitability. It involves digging past marketing claims and analyzing raw data to understand a signal's true value and reliability in real market conditions. This guide provides the practical steps to do just that.
Why Signal Marketing Can Be Deceiving
The trading signal industry is rife with aggressive marketing designed to attract new clients. The trading signal industry is rife with aggressive marketing designed to attract new clients. Providers often showcase cherry-picked winning trades or highlight unrealistic return percentages, creating a distorted picture of their actual performance. They might advertise a high win rate, but fail to mention the size of losses incurred on losing trades, or the frequency of losing streaks. For instance, a signal service might boast a 70% win rate, which sounds impressive. However, if the average losing trade is 300 pips and the average winning trade is only 50 pips, that 70% win rate will still lead to significant net losses over time. Another common tactic is to promote signals that are only profitable during specific market conditions, like strong trending phases, while performing poorly in volatile or range-bound markets. Without understanding the full context, traders can be easily misled into subscribing to services that drain their capital.
Scenario 1: The 'Golden Cross' Signal Provider
- Situation: A provider advertises a strategy based on the Golden Cross moving average crossover, claiming a 90% success rate in the past year.
- Recommended Option: Verify the actual trade logs for the last 12-24 months, noting entry/exit points, stop-loss and take-profit levels for every signal.
- Alternative Option: Look for independent reviews and track record verification from reputable third-party auditors, if available.
- What to Avoid: Solely trusting the advertised percentage and accepting the signal service at face value.
- Explanation: The Golden Cross can generate many false signals in choppy markets. A 90% win rate might be achievable if only the most opportune signals were selected retrospectively, or if very tight stop losses were used and then immediately re-entered, which isn't practical for most traders.
Key Metrics for Performance Analysis
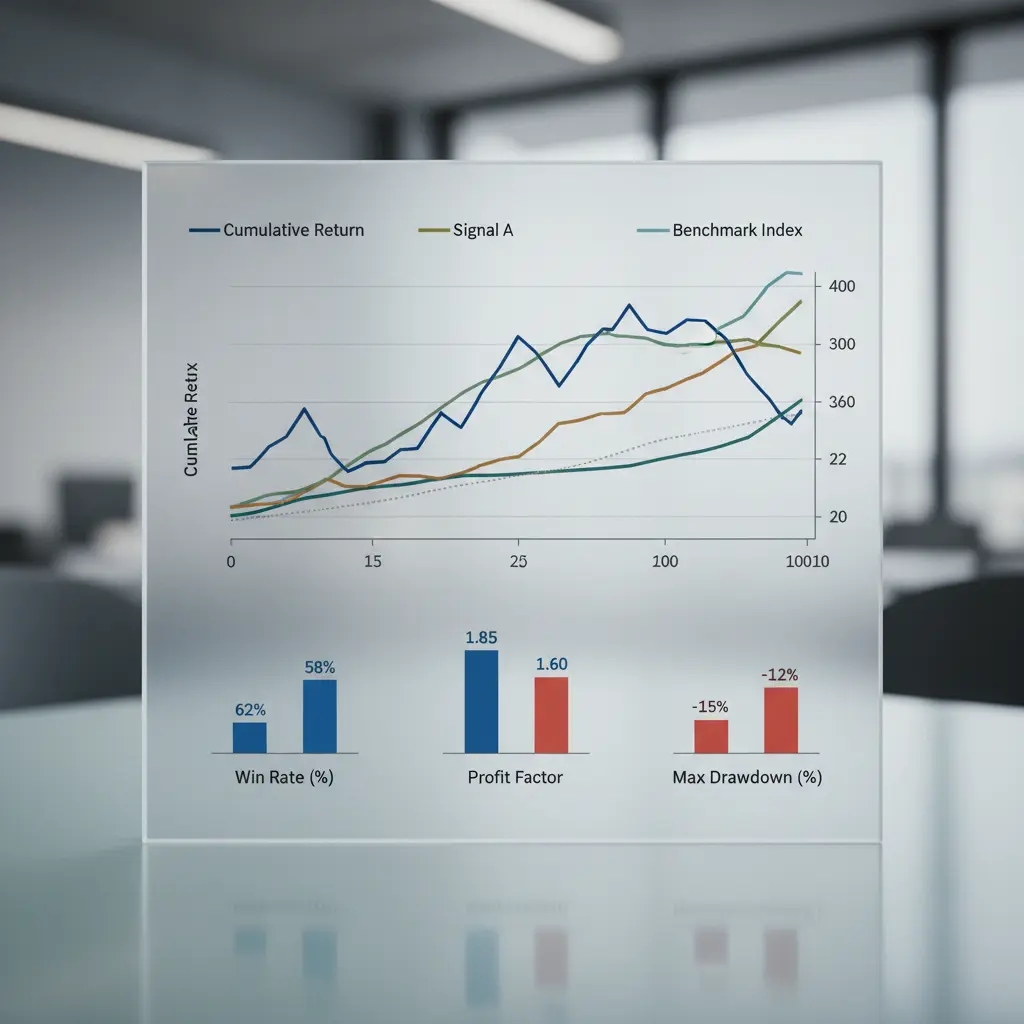
Moving beyond vague promises requires a focus on specific, quantifiable metrics. Moving beyond vague promises requires a focus on specific, quantifiable metrics. The most telling indicators of a signal's true performance are not just win rates, but a combination of factors that reveal profitability and risk. Profit Factor, for example, measures the ratio of gross profits to gross losses. A Profit Factor above 1.0 indicates profitability; above 1.5 is generally considered good, and above 2.0 is excellent. If a signal service has a Profit Factor of 0.8, it means for every dollar made, a dollar and a quarter is lost. This is a clear sign of a losing strategy, regardless of the win rate. Another vital metric is the Maximum Drawdown, which shows the largest percentage loss from a peak in equity to a trough before a new peak is attained. A high Maximum Drawdown, even with a positive Profit Factor, suggests extreme volatility in equity and a high risk of significant capital loss. Understanding these metrics allows for a much clearer picture of a signal's viability.
Calculating Risk-Adjusted Returns
Profitability alone isn't the full story; risk must be factored in. Profitability alone isn't the full story; risk must be factored in. A strategy that generates a high return but also involves extremely high risk might not be superior to a more conservative approach with moderate returns. The Sharpe Ratio is a widely used metric to measure risk-adjusted return. It calculates the excess return of an investment over the risk-free rate, per unit of volatility (standard deviation). A higher Sharpe Ratio indicates better performance for the amount of risk taken. For instance, if Signal A returned 15% with a standard deviation of 10%, and Signal B returned 20% with a standard deviation of 20%, Signal A might be more attractive from a risk perspective. (Sharpe Ratio for A = (15-RiskFreeRate)/10; Sharpe Ratio for B = (20-RiskFreeRate)/20). Comparing these ratios provides a more balanced view of performance. Similarly, the Sortino Ratio focuses on downside deviation, measuring returns against negative volatility, which can be more relevant for traders primarily concerned with avoiding losses.
Scenario 2: High-Return, High-Volatility Signal
- Situation: A signal provider shows a 50% annual return but a Maximum Drawdown of 40%.
- Recommended Option: Calculate the Sharpe Ratio or Sortino Ratio to assess if the return justifies the volatility.
- Alternative Option: Compare this signal's risk-adjusted return against other signals or your own trading strategy's metrics.
- What to Avoid: Being solely impressed by the high percentage return without considering the associated risk.
- Explanation: A 40% drawdown means you could lose nearly half your capital during a bad period. This level of risk might be unacceptable for many traders, regardless of the potential upside.
Backtesting vs. Live Performance
Many signal providers rely heavily on backtested results. Many signal providers rely heavily on backtested results. While backtesting is an essential tool for strategy development and initial validation, it has significant limitations. Backtests are performed on historical data, which may not accurately reflect future market conditions. They also often fail to account for slippage, trading commissions, and the psychological impact of real-time trading decisions. A strategy that looked brilliant on paper during a backtest might underperform drastically in live trading. Therefore, it's crucial to look for signal providers who offer verified live trading records, ideally through independent third-party platforms like Myfxbook or FXBlue. These platforms track actual trades executed in live accounts, providing a more realistic performance picture. When evaluating live performance, pay attention to the duration of the track record; a few weeks or months is insufficient. A history of at least 6-12 months, preferably longer, across different market regimes, provides more confidence.
Scenario 3: The Optimized Backtest Mirage
- Situation: A provider shows a backtest from 2010-2023 with incredible results, claiming it's 'fully optimized.'
- Recommended Option: Request access to a live trading account statement for the last 6-12 months, or a verified track record on a third-party monitoring site.
- Alternative Option: Look for providers who offer a demo period where you can observe signals in real-time trading conditions.
- What to Avoid: Relying solely on historical backtest data, especially if it appears 'too good to be true.'
- Explanation: Over-optimization (curve-fitting) can create strategies that perform exceptionally well on historical data but fail in live markets because they are tailored to past inefficiencies that no longer exist.
Understanding the Trading Journal's Role
A trader's own trading journal is perhaps the most powerful tool for evaluating not just signals, but their own trading decisions. A trader's own trading journal is perhaps the most powerful tool for evaluating not just signals, but their own trading decisions. When using external signals, your journal should meticulously record every trade taken based on those signals. This includes the signal's entry and exit recommendations, your actual entry and exit points, the reason for taking the trade (based on the signal), and crucially, your emotional state and any deviations from the signal's recommendation. By analyzing your journal, you can identify if you are correctly following signals, if there are specific types of signals you consistently misinterpret, or if your own execution is introducing errors. This personal data provides invaluable insights that generic performance metrics cannot. For example, you might find that you consistently exit trades too early, cutting short potential profits from a signal that would have otherwise been a winner, or you might hesitate to enter a signal trade due to fear, missing a profitable opportunity. Tools like PipsAlerts' Trading Journal can help structure this analysis.
Assessing Signal Strategy & Market Fit
Not all trading strategies are created equal, and their effectiveness varies significantly depending on the prevailing market conditions. Not all trading strategies are created equal, and their effectiveness varies significantly depending on the prevailing market conditions. A signal based on a mean-reversion strategy might perform brilliantly in a range-bound market but falter in a strong trending market. Conversely, a trend-following signal will excel in trending conditions but struggle in sideways markets. Therefore, understanding the underlying strategy of the signals you are evaluating is critical. Ask the provider: Is it trend-following, mean-reversion, breakout-based, or something else? Then, observe the current market environment. If a provider is promoting a trend-following signal service during a period of high market uncertainty and consolidation, their performance is likely to suffer, and this shouldn't necessarily be a indictment of the strategy itself, but rather its poor market fit at that moment. A truly robust signal service would ideally demonstrate consistent performance across various market conditions or clearly state its preferred market environment. Market analysis tools can help traders identify these conditions.
Scenario 4: Trend-Follower in a Ranging Market
- Situation: A trader is using a signal service known for its trend-following capabilities during a week where major currency pairs are consolidating within tight ranges.
- Recommended Option: Temporarily pause trading based on these signals or switch to signals designed for range-bound markets.
- Alternative Option: Use your trading journal to note the losses incurred and analyze how many were due to the signal's strategy mismatch with market conditions.
- What to Avoid: Blaming the signal provider for losses without considering the market context and strategy fit.
- Explanation: Trend-following systems generate frequent whipsaws and false signals in non-trending, range-bound markets, leading to losses.
Cost vs. Value: A Practical Calculation
The cost of a trading signal service needs to be weighed against its potential value. The cost of a trading signal service needs to be weighed against its potential value. It's not just about the subscription fee; it's about how much capital you might realistically make or lose by following those signals. A simple way to assess this is to consider the net profit required to cover the subscription cost. If a signal service costs $100 per month, and your average trade size is 0.1 lots, you need to generate an additional profit of 1000 pips per month (assuming $0.10 per pip for 0.1 lots) just to break even on the subscription cost. If your trading capital is small, say $5,000, a monthly gain of $100 (2% of capital) is a significant hurdle. Many traders would be happy with 2-5% monthly gains overall. Therefore, it's essential to understand your potential profit targets and compare them realistically against the service's cost and its proven ability to generate those profits after accounting for risk. Effective risk management ensures you don't risk an amount that makes the subscription cost prohibitive.
Scenario 5: Expensive Signals, Modest Gains
- Situation: A signal service costs $500 per month and claims an average monthly return of 3% on capital.
- Recommended Option: Calculate the breakeven point. For a $10,000 account, a 3% return is $300. With a $500 cost, the net return is $300 - $500 = -$200. This means the service is losing you money unless it generates significantly more than 3%.
- Alternative Option: Seek out lower-cost or free (but verified) signals, or focus on developing your own strategies.
- What to Avoid: Paying a premium for signals without a clear, quantifiable path to net profitability after all costs.
- Explanation: High subscription fees can negate even positive trading performance if the returns are not substantial enough to cover the costs and still provide a decent profit.
The PipsAlerts Approach to Signal Evaluation
At PipsAlerts, we understand the challenges traders face when selecting signal providers. At PipsAlerts, we understand the challenges traders face when selecting signal providers. Our focus is not on selling signals, but on educating you to make informed decisions. We advocate for a data-driven approach, emphasizing the use of verified track records, rigorous metric analysis, and personal trading journal insights. We provide tools and educational content, such as our comprehensive Trading Journal guide, to empower you. Instead of blindly trusting marketing, we encourage you to ask critical questions: What is the real Profit Factor? What is the Maximum Drawdown? How does it perform across different market conditions? By equipping yourself with this knowledge and utilizing resources like PipsAlerts, you can cut through the noise and identify strategies and signals that genuinely align with your trading goals and risk tolerance.

When to Consider Signals vs. Self-Trading
Deciding whether to use trading signals or rely solely on your own trading is a significant choice. Deciding whether to use trading signals or rely solely on your own trading is a significant choice. Signals can be beneficial for traders who lack the time or expertise to develop and monitor their own strategies, or for those looking to supplement their existing methods. They can offer exposure to different market approaches and potentially identify opportunities that might otherwise be missed. However, signals are not a passive income stream; they require active management and verification. If you are a disciplined trader with a solid understanding of market mechanics and risk management, developing your own strategies often provides greater control, deeper market understanding, and potentially higher long-term profitability, albeit with a significant time investment in learning and execution. The key is to treat signals as a tool to be evaluated, not a magic bullet. If your analysis of a signal service's performance, risk profile, and cost reveals a net positive edge that fits your trading plan, it might be a valuable addition. Otherwise, focusing on honing your own skills and utilizing resources like our Portfolio Analysis guide can be more rewarding.
Scenario 6: New Trader vs. Experienced Trader with Signals
- Situation: A beginner trader is overwhelmed by the market and considers a signal service for quick profits. An experienced trader wants to test a new asset class using signals.
- Recommended Option (Beginner): Focus on learning the basics of trading and risk management first, perhaps using signals only on a demo account after thorough evaluation.
- Alternative Option (Beginner): Use signals as learning tools, meticulously journaling every trade to understand why they succeeded or failed, rather than expecting consistent results.
- Recommended Option (Experienced Trader): Thoroughly vet the signals for the new asset class, focusing on historical performance in similar market conditions and understanding the strategy's logic.
- What to Avoid (Both): Assuming signals will lead to effortless profits without due diligence and active monitoring.
- Explanation: Beginners may lack the discipline and knowledge to use signals effectively, risking capital. Experienced traders can leverage signals to explore new areas, but must apply the same rigorous evaluation they would to any strategy.
| Evaluation Point | Key Questions to Ask | Ideal Answer / What to Look For | Potential Red Flags |
|---|---|---|---|
| Performance Metrics | What is the Profit Factor? Max Drawdown? Win Rate? | Profit Factor > 1.5, Max Drawdown < 20%, Consistent Win Rate (e.g., 50-60% with good Risk Reward) | Profit Factor < 1.0, High Max Drawdown (>30%), Extremely high win rate with small wins and large losses |
| Risk-Adjusted Return | What is the Sharpe Ratio/Sortino Ratio? | High Sharpe/Sortino Ratio (relative to benchmark or other signals) | Low or negative Sharpe/Sortino Ratio |
| Track Record | Is it a live, verified track record? How long is it? | Minimum 6-12 months on a reputable third-party platform (Myfxbook, FXBlue) | Only backtested results, short track record (less than 3 months), unverified statements |
| Strategy & Market Fit | What is the underlying strategy? How does it perform in different market conditions? | Clear strategy explanation, reasonable performance across trending and ranging markets | Vague strategy details, only shows performance during specific market conditions |
| Cost vs. Value | What is the subscription cost? What is the net profit needed to cover it? | Cost is reasonable compared to potential net returns; clear path to profitability after costs | Exorbitant fees with unproven consistent returns, cost outweighs potential gains |
| Provider Transparency | Are they upfront about risks? Do they offer support? | Open about risks, offers educational resources, responsive support | Guarantees unrealistic profits, evasive about details, pushy sales tactics |
| Independent Reviews | What do other users and reputable sites say? | Generally positive, balanced reviews highlighting both pros and cons | Overwhelmingly negative reviews, lack of independent verification |
Conclusion: Empowering Your Trading Decisions
Navigating the world of trading signals requires a discerning eye and a commitment to objective analysis. Navigating the world of trading signals requires a discerning eye and a commitment to objective analysis. By moving beyond marketing hype and focusing on verifiable performance metrics, risk-adjusted returns, and the crucial role of your own trading journal, you can make far more informed decisions. Remember that no signal service is a substitute for sound risk management and continuous learning. Utilize the resources and educational insights from PipsAlerts to build a robust trading approach. By diligently applying these evaluation principles, you'll be better equipped to discern valuable tools from costly distractions, ultimately enhancing your trading success.
Step-by-step trading workflow
Evaluate Trading Signal Performance: Beyond the Hype works better when the process is explicit. Use a short ordered checklist before you act.
- Define the setup and the exact reason it is on your radar.
- Measure the downside first, including stop distance and position size.
- Check whether the reward and market context still justify the trade.
- Log the plan so execution can be reviewed after the outcome is known.
Related reading: trading risk management