
Focusing on the right metrics in your trading journal is critical for long-term success. Simply recording wins and losses misses the underlying reasons for both, preventing you from making informed adjustments to your strategy.
What is a Trading Journal and Why Track Metrics?
A trading journal is more than just a log of your trades; it's your personal performance analysis tool. A trading journal is more than just a log of your trades; it's your personal performance analysis tool. It documents every trade you take, including entry and exit points, size, reasons for the trade, and the outcome. The real power lies in the metrics you extract from this data. Tracking specific metrics allows you to move beyond subjective feelings about your trading and identify concrete areas for improvement. Without this systematic approach, you're essentially trading blind, repeating the same mistakes without understanding why. For instance, consistently taking trades that lose a small percentage but rarely capturing big winners might look like a break-even strategy on the surface, but a deeper dive into metrics like average win size versus average loss size will tell a different story. It's this quantitative feedback loop that separates consistent traders from those who struggle.
Essential Metrics for Trading Journals
While many metrics can be tracked, a focused approach is best. While many metrics can be tracked, a focused approach is best. Start with the ones that offer the most direct insight into your strategy's effectiveness and your risk management. These aren't just vanity numbers; they're indicators of your trading process. We'll cover profit factor, win rate, average win/loss ratio, expectancy, and drawdown, explaining why each matters and how to interpret them.
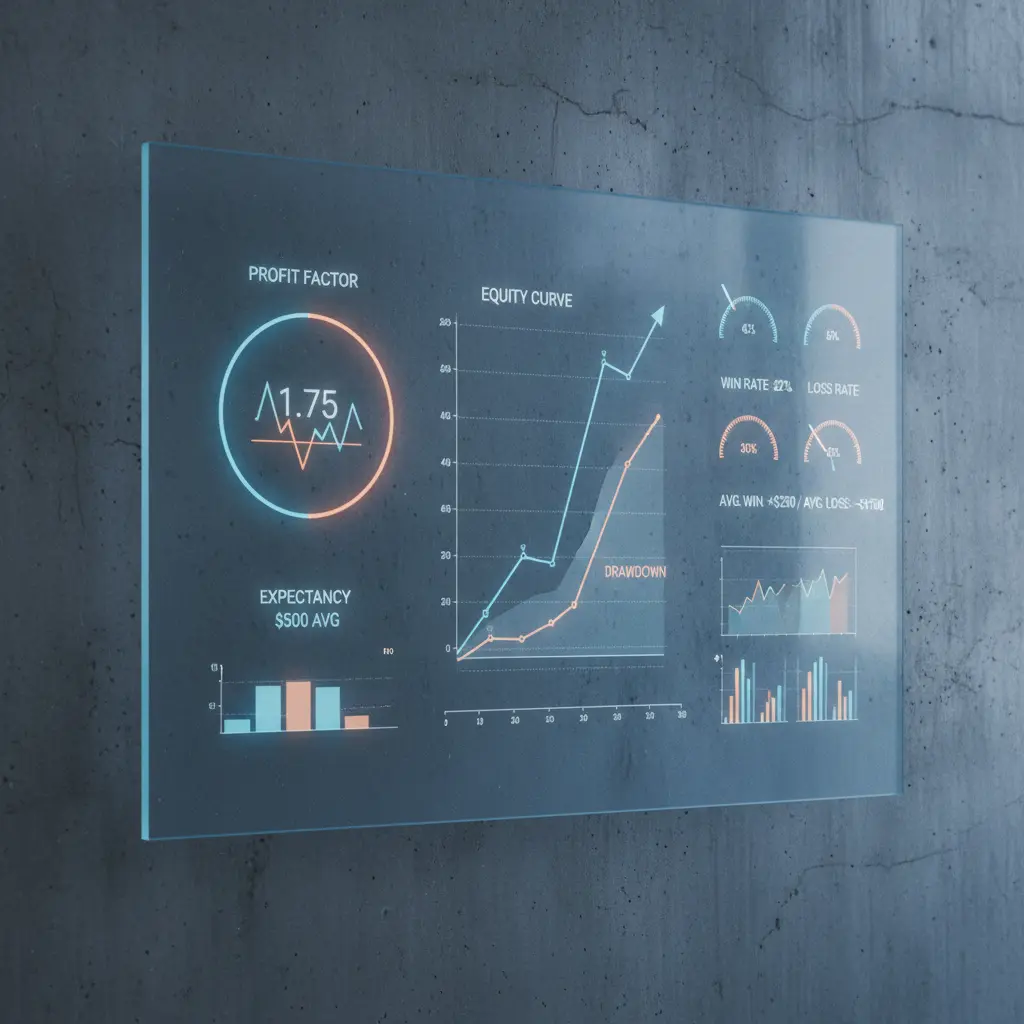
Profit Factor: This is the ratio of gross profits to gross losses. A profit factor above 1 indicates profitability, while a profit factor below 1 shows a net loss. A profit factor of 2 means you made $2 for every $1 lost. This metric is crucial because it shows the overall efficiency of your trading system.
Win Rate: The percentage of trades that were profitable. While important, a high win rate doesn't guarantee profitability if the losses outweigh the wins. It's one piece of the puzzle.
Average Win Size vs. Average Loss Size: This compares the average profit of winning trades to the average loss of losing trades. A favorable ratio here (average win significantly larger than average loss) can compensate for a lower win rate.
Expectancy: Calculated as (Win Rate Average Win Size) - (Loss Rate Average Loss Size). Expectancy tells you, on average, how much you can expect to make or lose per trade over the long run. A positive expectancy is the cornerstone of a profitable system.
Maximum Drawdown: The largest percentage drop from a peak equity value to a subsequent trough before a new peak is attained. This metric is vital for understanding the risk you're exposed to and your capital preservation capability.
Scenario 1: The High-Frequency Trader
Situation: A day trader executes dozens of trades daily. Their journal shows a 70% win rate but a low profit factor of 0.8.
Recommended Option: Analyze the average win and average loss. The trader likely has many small wins overshadowed by a few larger losses.
Alternative Option: Focus solely on increasing the win rate further.
What to Avoid: Complacency due to the high win rate, ignoring the overall loss.
Explanation: The problem isn't winning; it's that the winning trades aren't large enough to cover the losing ones. The trader needs to either let winners run more or cut losers faster and more decisively. Targeting a profit factor of 1.5 or higher would be a good goal.
Scenario 2: The Patient Swing Trader
Situation: A swing trader takes fewer trades but holds them for days or weeks. Their journal shows a 40% win rate but a strong profit factor of 2.5.
Recommended Option: Continue refining entry signals to improve the quality of trades and maintain discipline with stop-losses.
Alternative Option: Increase trade frequency by taking lower-conviction setups.
What to Avoid: Chasing trades or entering positions without a clear, pre-defined setup.
Explanation: This trader's strategy works because their winning trades are significantly larger than their losing trades. The focus should be on preserving this edge by sticking to the proven strategy and avoiding impulsive actions.

Understanding Expectancy
Expectancy is arguably the most powerful metric because it encapsulates the expected outcome of your trading strategy over many trades. Expectancy is arguably the most powerful metric because it encapsulates the expected outcome of your trading strategy over many trades. It directly answers the question: 'On average, how much money does this strategy make or lose per trade?' A positive expectancy of $5 means that, on average, each trade taken with this strategy is expected to yield a $5 profit. Conversely, an expectancy of -$2 means you lose $2 on average per trade.
To calculate expectancy: First, determine your win rate (e.g., 50% or 0.50) and loss rate (1 - Win Rate, e.g., 50% or 0.50). Then, find your average win amount and average loss amount. For instance, if your average win is $100 and your average loss is $50, and your win rate is 40% (0.40), your loss rate is 60% (0.60):
Expectancy = (0.40 $100) - (0.60 $50) = $40 - $30 = $10
In this example, the strategy has a positive expectancy of $10 per trade. This means that even with a lower win rate, the strategy is profitable because the wins are proportionally larger than the losses. If the average win was only $60, the expectancy would be (0.40 $60) - (0.60 $50) = $24 - $30 = -$6, indicating a negative expectancy and a losing strategy.
Scenario 3: The Break-Even Trader
Situation: A trader's journal shows a 50% win rate, a 1:1 average win/loss ratio, and near-zero expectancy.
Recommended Option: Focus on improving either the win rate or the average win/loss ratio. Even a slight improvement in one can lead to significant profitability.
Alternative Option: Increase trade volume to compensate for low per-trade profitability.
What to Avoid: Blaming market conditions or external factors for lack of progress.
Explanation: This trader is essentially breaking even after commissions and slippage. They need to make a conscious effort to either let winners run a bit further or cut losers a bit quicker to create a more favorable average win/loss ratio, or refine their entry signals to win more often.
Scenario 4: The Aggressive Risk-Taker
Situation: A trader has a high profit factor (3.0) and positive expectancy, but experiences extreme drawdowns exceeding 30% after a series of losses.
Recommended Option: Implement stricter risk management rules, potentially reducing position size or setting tighter stop-losses.
Alternative Option: Continue as is, assuming the large wins will eventually recover losses.
What to Avoid: Ignoring the psychological toll of large drawdowns, which can lead to impulsive decisions.
Explanation: While the strategy is mathematically profitable, the level of risk is unsustainable for most traders. High drawdowns can lead to emotional distress and account blow-ups. A trader must balance profitability with acceptable risk. Reviewing the basics of risk management is essential here.
Scenario 5: The Under-Traded System
Situation: A trader has a robust strategy with positive expectancy and low drawdowns, but only takes a few trades per month.
Recommended Option: Systematically identify and execute all high-probability setups according to the strategy's rules, potentially increasing trade frequency.
Alternative Option: Wait for even higher-probability setups, which may be rare.
What to Avoid: Forcing trades or deviating from the strategy's entry criteria to find more action.
Explanation: This trader has a good strategy but isn't giving it enough opportunities to perform. The goal should be to increase the sample size of trades to confirm the statistical edge, without compromising the quality of the setups. This might involve adjusting the parameters or broadening the search for qualifying trades.
Scenario 6: The Over-Traded System
Situation: A trader's journal shows a decent strategy but an extremely high trade frequency, leading to increased transaction costs and fatigue.
Recommended Option: Filter trades more rigorously, focusing only on the highest-conviction setups defined by the strategy's rules.
Alternative Option: Continue trading frequently, hoping to make up for lower per-trade edge with volume.
What to Avoid: Trading out of boredom or seeking constant action, which erodes capital.
Explanation: Every trade incurs costs (commissions, slippage). When a strategy's edge is small, high frequency can quickly turn a potentially profitable system into a losing one. Reducing trade frequency to focus on quality over quantity is key.
The Role of Your Trading Journal in Portfolio Analysis
Your trading journal is the raw material for effective portfolio analysis . Your trading journal is the raw material for effective portfolio analysis. By dissecting your journal entries based on different metrics, you can gain profound insights. Are certain currency pairs or asset classes performing better? Does your strategy perform differently in trending versus ranging markets? Are your best trades initiated during specific market hours or following particular news events? Answering these questions requires more than just logging trades; it demands thoughtful analysis of the data you've collected.
For example, you might find that your strategy performs exceptionally well on EUR/USD during the London session but struggles on USD/JPY during the New York session. This insight allows you to tailor your trading activity. You could choose to focus more on EUR/USD during London hours and reduce or avoid USD/JPY trades during New York. This kind of refined decision-making, powered by data from your journal, is what separates professional traders from amateurs. Tools like advanced charting software and specialized trading journal platforms can help automate some of this analysis, but the initial data input and interpretation still rely on your discipline.
Key Trade Metrics Comparison
The following table summarizes how different metrics can inform your trading decisions. The following table summarizes how different metrics can inform your trading decisions. It's not about one metric being superior, but how they work together to paint a complete picture of your trading performance.
| Metric | What it Tells You | Actionable Insight | Related Tools |
|---|---|---|---|
| Profit Factor | Overall system profitability (Gross Profit / Gross Loss) | Indicates if your winners are large enough to cover losses. Aim for > 1.5. | Trading Journal Software |
| Win Rate | Frequency of profitable trades | High win rate is good, but only if wins outweigh losses. | Manual analysis, Journaling tools |
| Average Win/Loss Ratio | Average profit of winning trades vs. average loss of losing trades | Crucial for understanding if you capture enough on winners to offset losses. Aim for > 1:1, ideally higher. | Trading Journal Software |
| Expectancy | Average profit/loss per trade (per dollar risked or per unit) | The true measure of a strategy's profitability over time. Needs to be positive. | Calculators, Journaling tools |
| Max Drawdown | Largest peak-to-trough equity decline | Measures risk tolerance and capital preservation. Crucial for position sizing. | Portfolio analysis tools, Risk management calculators |
| Trade Frequency | Number of trades taken over a period | Too high can increase costs and fatigue; too low might miss opportunities. | Journaling tools, Market scanners |
| Correlation of Trades | How trades relate to each other (e.g., consecutive wins/losses) | Identifies potential batching effects or psychological impacts. | Advanced journaling and statistical analysis software |
| Trade Setup Performance | Performance of specific entry signals or patterns | Reveals which setups are most reliable and profitable. | Journaling tools, Strategy backtesting software |
Scenario 7: The 'System Hopping' Trader
Situation: A trader is constantly switching strategies, rarely giving any one system enough trades to prove itself. Their journal is a mess of different approaches.
Recommended Option: Pick one or two well-defined strategies, commit to them for a significant number of trades (e.g., 100+), and analyze the metrics rigorously.
Alternative Option: Continue looking for the 'holy grail' system.
What to Avoid: Making decisions based on recent performance alone, without considering the long-term statistical edge of a strategy.
Explanation: Consistency is paramount. Without a sufficient sample size for a given strategy, it's impossible to know if its performance is due to skill, luck, or market conditions. Focusing on metrics for a single, defined system is the only way to gain reliable insights and make improvements. Explore our guides on setting up your trading journal to start systematically.
Scenario 8: The 'Stuck' Trader
Situation: A trader has a strategy that historically performed well, but its metrics (expectancy, profit factor) have degraded recently.
Recommended Option: Re-evaluate the strategy's edge. Has the market regime shifted? Are there new inefficiencies? Can the strategy be adapted?
Alternative Option: Ignore the declining metrics, assuming it's a temporary drawdown.
What to Avoid: Continuing to use a strategy that is no longer statistically sound without adaptation.
Explanation: Markets evolve. What worked a year ago might not work today. Use your journaled metrics to detect these shifts early. If a strategy's edge erodes, you need to either adapt it or transition to a new one. This requires objective analysis of performance data, not emotional attachment to a past strategy.
Conclusion: Data-Driven Trading Decisions
Your trading journal is your most valuable asset for continuous improvement. Your trading journal is your most valuable asset for continuous improvement. By meticulously tracking and analyzing metrics like profit factor, expectancy, and drawdown, you gain objective insights into your performance. This data allows you to refine your strategy, manage risk effectively, and make more informed decisions. Remember, consistent profitability comes from a disciplined process supported by solid data, not from hoping for the best. Regularly reviewing your journal and focusing on these key metrics will guide you towards a more successful trading career.
Step-by-step trading workflow
Beyond Wins and Losses: Trading Journal Metrics That Drive Profitability works better when the process is explicit. Use a short ordered checklist before you act.
- Define the setup and the exact reason it is on your radar.
- Measure the downside first, including stop distance and position size.
- Check whether the reward and market context still justify the trade.
- Log the plan so execution can be reviewed after the outcome is known.
Start with the cluster hub. Read trading journal guides first if you want the broader workflow behind this topic.
Related reading: how to use a trading journal | day trading journal review